Machine Learning Patterns, Mechanisms > Data Exploration Patterns > Graphical Summary Computation
Graphical Summary Computation (Khattak)
How can intuition about a dataset be developed beyond computation of simple descriptive statistics?
Problem
Generating descriptive statistics, such as numerical summaries, helps quantify various aspects of a dataset. However, these techniques alone fail to capture any trends or patterns hidden in the dataset that can be easily identified by humans.
Solution
The trends and patterns hidden in a dataset are identified by stimulating visual perception of humans through generating various charts.
Application
Various graphical summaries are generated from the dataset, including bar chart, histogram, scatter plot, cross-tabulation, and box and whisker plot.
Mechanisms
Query Engine, Processing Engine, Resource Manager, Storage Device, Visualization Engine
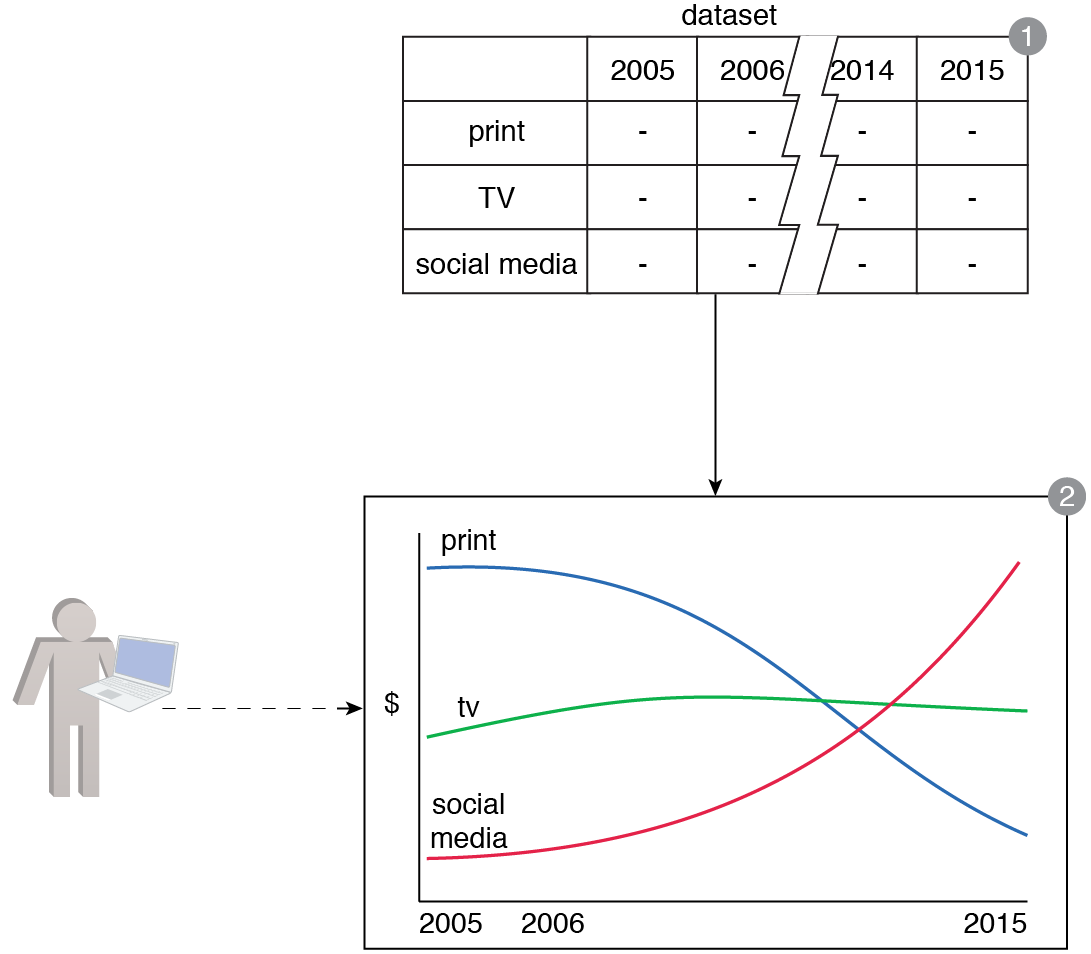
A dataset consists of marketing spend data for TV, print and social media channels over the span of several years (1). It needs to be determined whether the dataset contains any interesting patterns that can provide insight as to how the spend data differs across these channels (2). A line chart is created that depicts the marketing spend for each of the channels across all years, based on which it is determined that the print spend has drastically reduced while there has been a steady increase in social media spend (3).
 Module 10: Fundamental Big Data Architecture")
This pattern is covered in Machine Learning Module 2: Advanced Machine Learning.
For more information regarding the Machine Learning Specialist curriculum, visit www.arcitura.com/machinelearning.