Cloud Computing Patterns, Mechanisms > Mechanisms > R - S > SLA Management System
SLA Management System

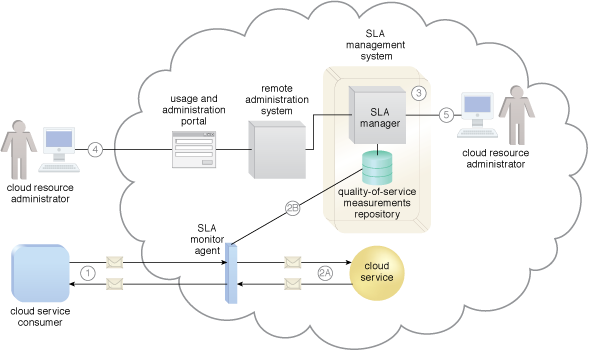
The SLA monitor mechanism is used to specifically observe the runtime performance of cloud services to ensure that they are fulfilling the contractual QoS requirements published in SLAs (Figure 1). The data collected by the SLA monitor is processed by an SLA management system to be aggregated into SLA reporting metrics. This system can proactively repair or failover cloud services when exception conditions occur, such as when the SLA monitor reports a cloud service as “down.”

Figure 1 – The SLA monitor polls the cloud service by sending over polling request messages (MREQ1 to MREQN). The monitor receives polling response messages (M to M ) that report that the service was “up” at each polling cycle (1a). The SLA monitor stores the “up” time—time period of all polling cycles 1 to N—in the log database (1b). The SLA monitor polls the cloud service that sends polling request messages (M to M ). Polling response messages are not received (2a). The response messages continue to time out, so the SLA monitor stores the “down” time—time period of all polling cycles N+1 to N+M—in the log database (2b). The SLA monitor sends a polling request message (M ) and receives the polling response message (M ) (3a). The SLA monitor stores the “up” time in the log database (3b).
Related Patterns:
- Bare-Metal Provisioning
- Dynamic Failure Detection and Recovery
- Non-Disruptive Service Relocation
- Realtime Resource Availability
This mechanism is covered in CCP Module 4: Fundamental Cloud Architecture.
For more information regarding the Cloud Certified Professional (CCP) curriculum, visit www.arcitura.com/ccp.
This cloud computing mechanism is covered in:
Cloud Computing: Concepts, Technology & Architecture by Thomas Erl, Zaigham Mahmood,
Ricardo Puttini
(ISBN: 9780133387520, Hardcover, 260+ Illustrations, 528 pages)
For more information about this book, visit www.arcitura.com/books.

